
ExoSense® · Condition Monitoring
Everything you need to get critical operational insight into your high-value assets.
ExoSense gives OEMs and service providers a live, configurable view of every customer's equipment, so a bearing running hot or a pump trending toward failure sends an alert and shows up on a dashboard before it becomes a service call.
One view.
Every customer, every site.
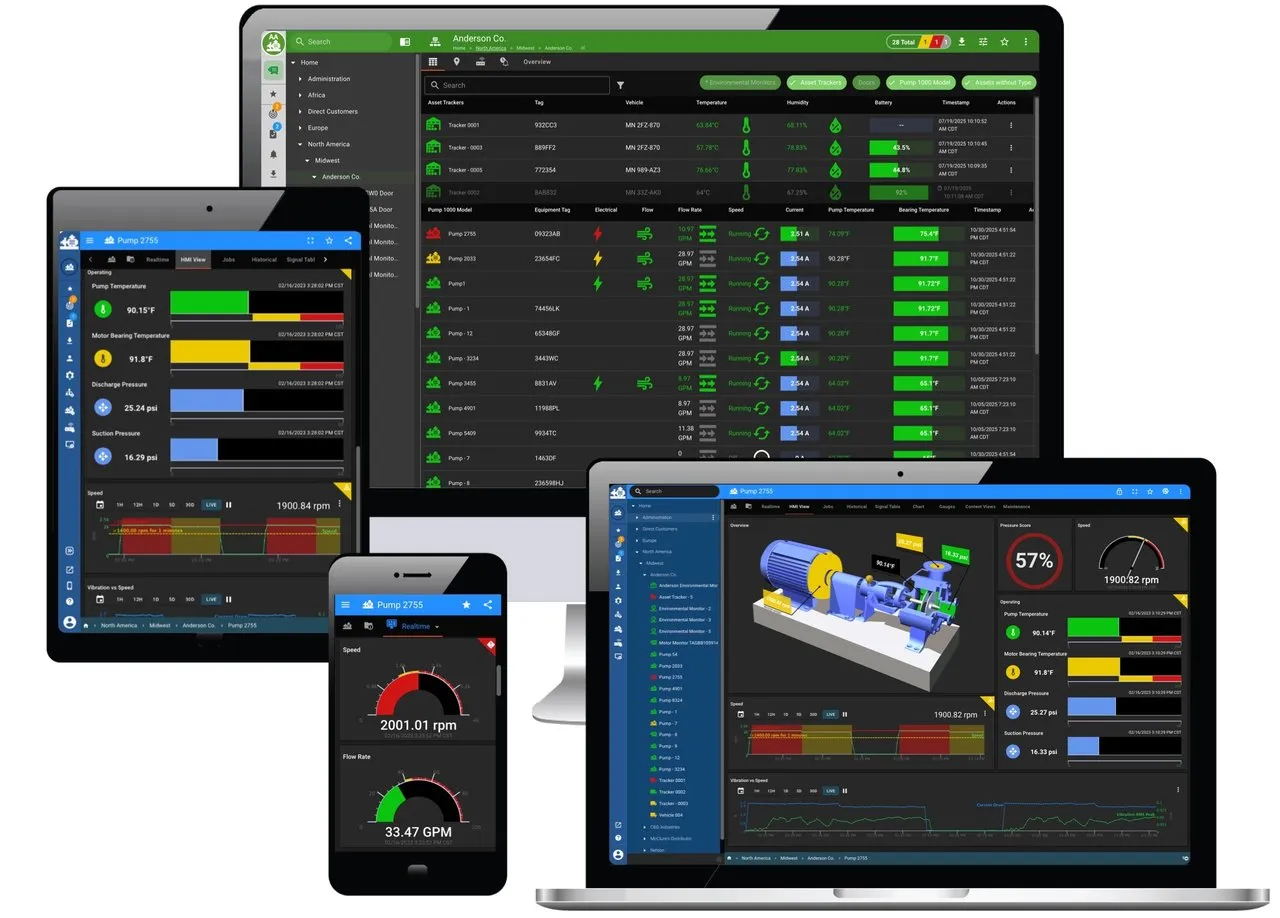
Every asset a customer connects rolls up into a single, searchable fleet view. Filter by status, site, customer, or asset type, and drill into any one of them without leaving the page.
Streaming data.
The moment it happens.
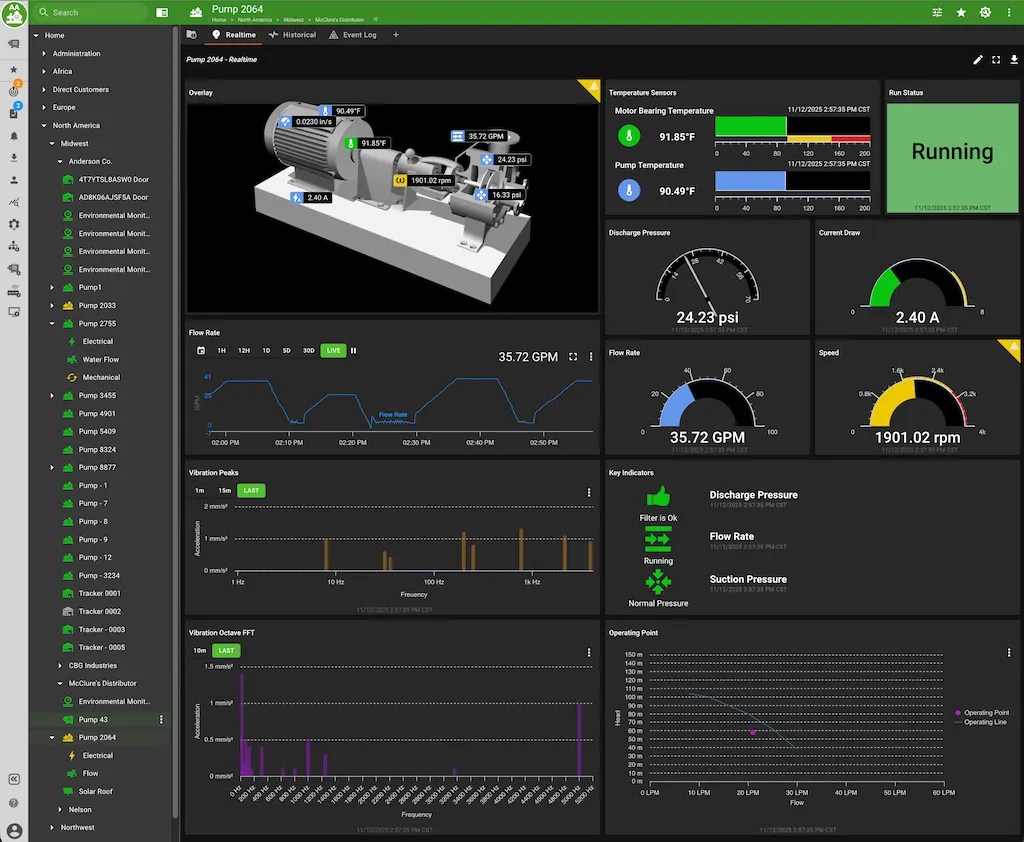
ExoSense dashboards are built for real-time industrial data, not polling intervals or page refreshes. Signal readings stream as they arrive, so customers see what's happening right now, not a minute ago.
Live signal panels
Gauge, chart, stat, and indicator panels that update as data arrives. No manual refresh, no cached snapshots.
Configurable dashboards
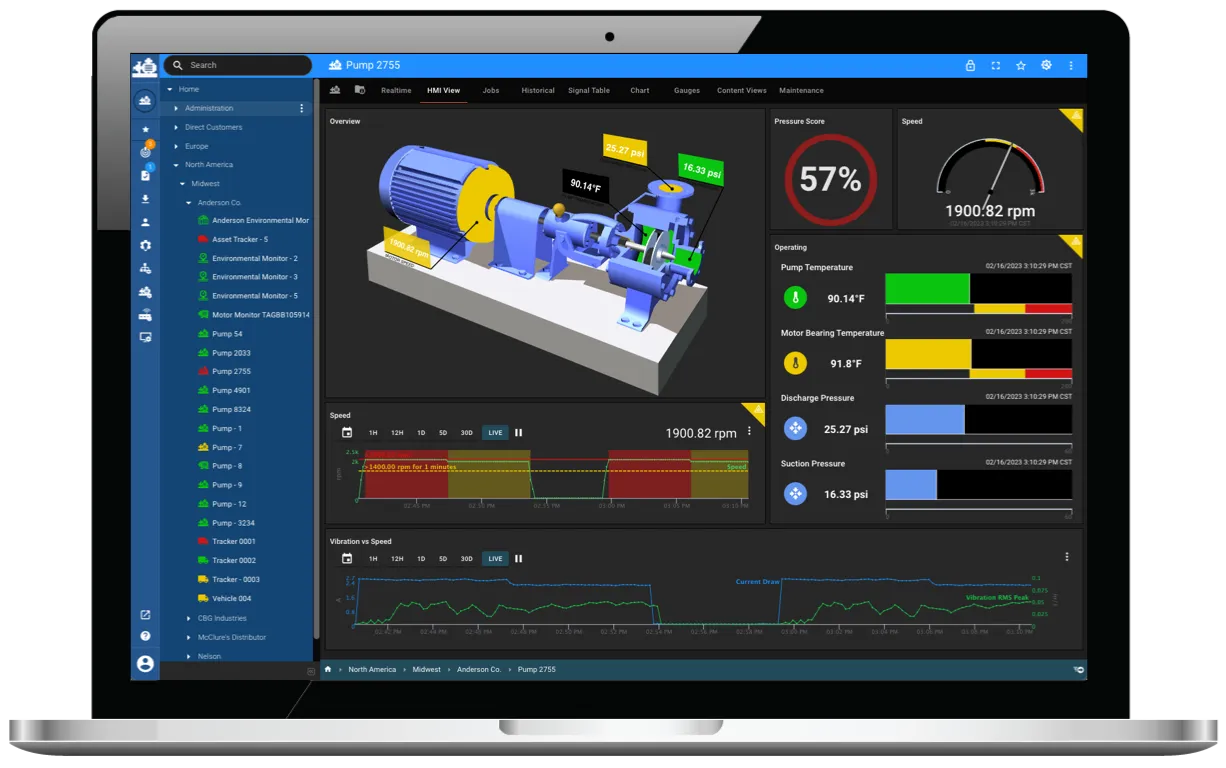
Customers arrange the panels that matter for their equipment, per asset, per site, or across their whole fleet.
Historical trends
30-day, 90-day, and custom time-range views with zoom. The pattern that preceded a failure is always accessible.
Vibration & frequency analysis
FFT and octave-band charts surface bearing wear and imbalance early, straight from the same streaming signals.
Timestamped data in the real world.
Units, time zones, and sources of truth matter in the industrial world. Every signal in ExoSense carries a strict data type and unit from the moment it's defined, so values convert natively wherever they're displayed instead of getting silently reinterpreted.
Typed by design
Signals are defined against an IoT-standard schema, carrying their data type and unit through every dashboard, rule, and export. The application can dynamically adjust unit and number formats to user preferences.
Data timezone and global deployments
Every reading is time-stamped to a single source of truth, so teams and customers working across time zones see the same sequence of events, dynamically changing based on how the user wants to see the data.
Asset management.
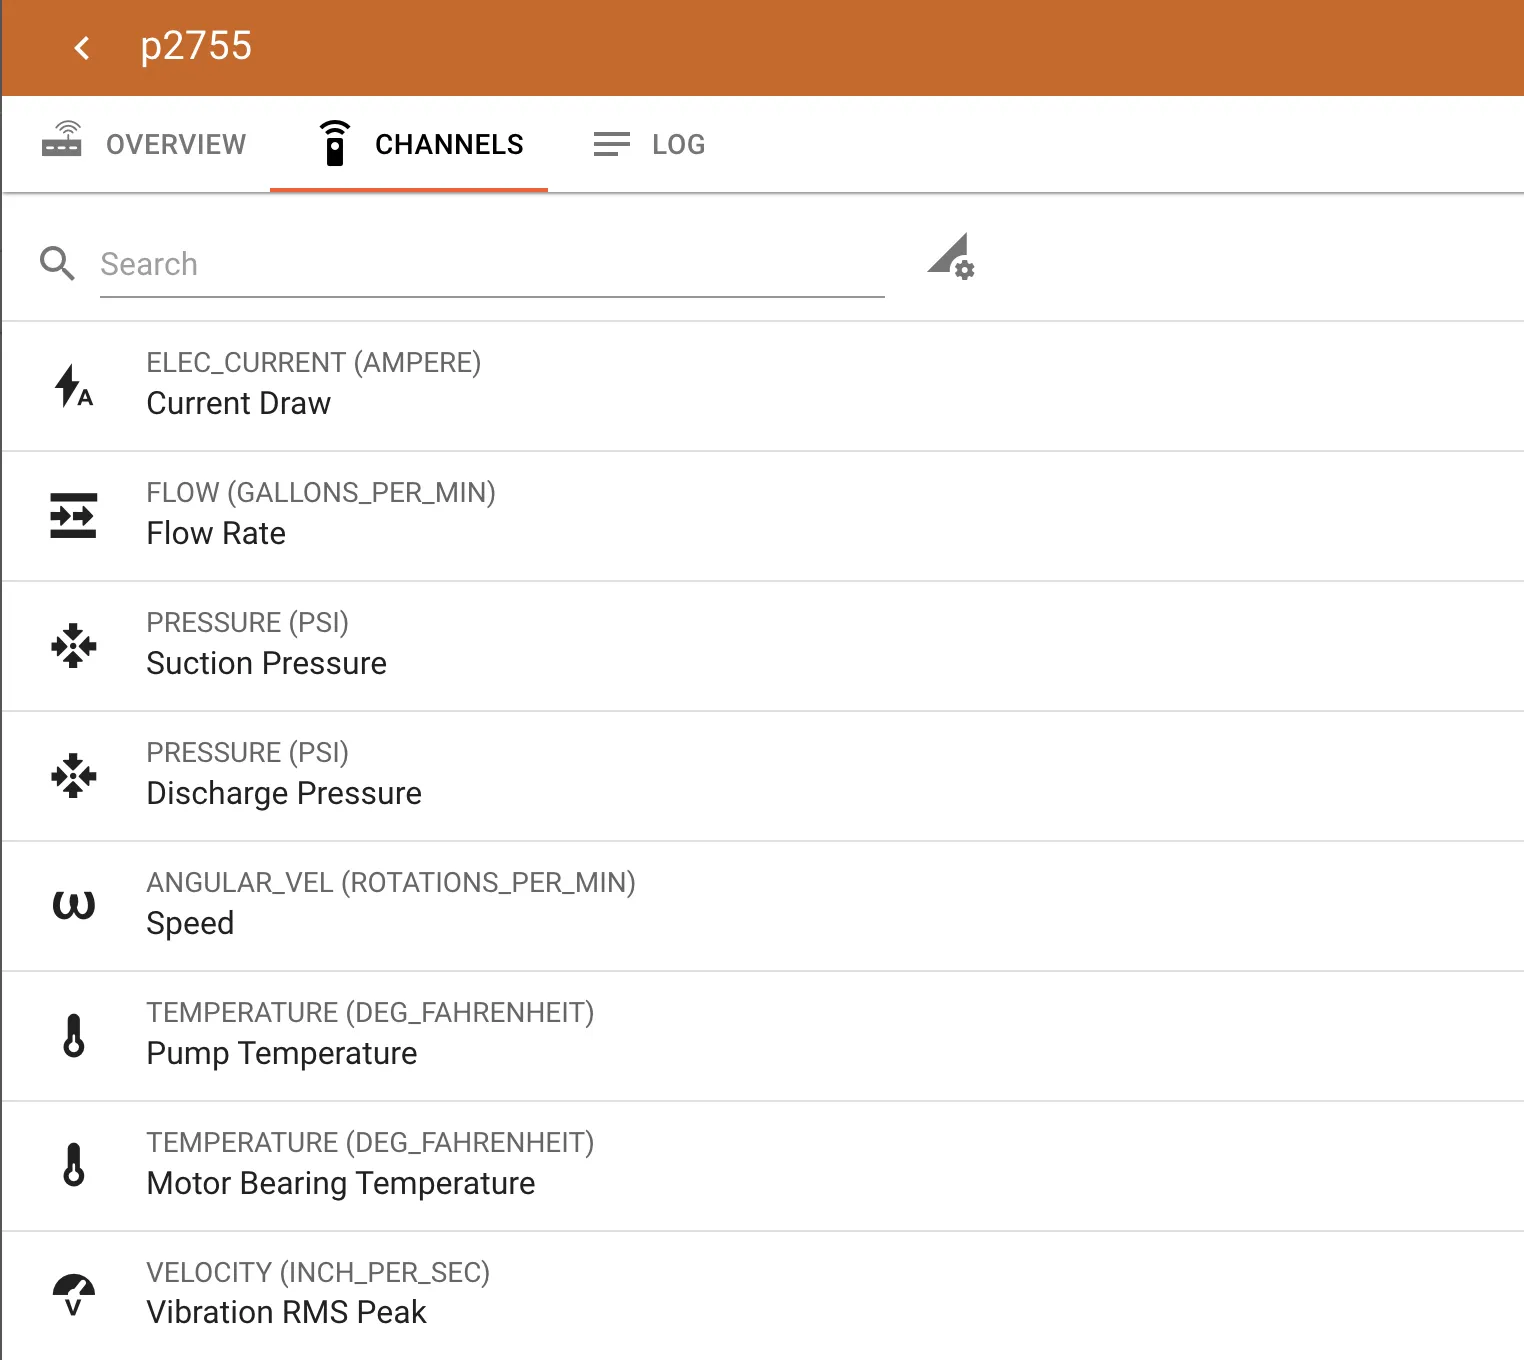
An asset in ExoSense is more than a stream of signals. Serial numbers, install dates, manuals, and service history live on the same record as the live data, so anyone working on that equipment has the full picture in one place.
Asset metadata
Serial numbers, install dates, and the other identifying details your team needs, stored right on the asset.
Content library
Manuals, reports, images, and logs, uploaded once and available to every user working on that asset.
Subsystem tags
Track the sub-level specifics of a complex, multi-component asset instead of flattening it into one record.
Asset types
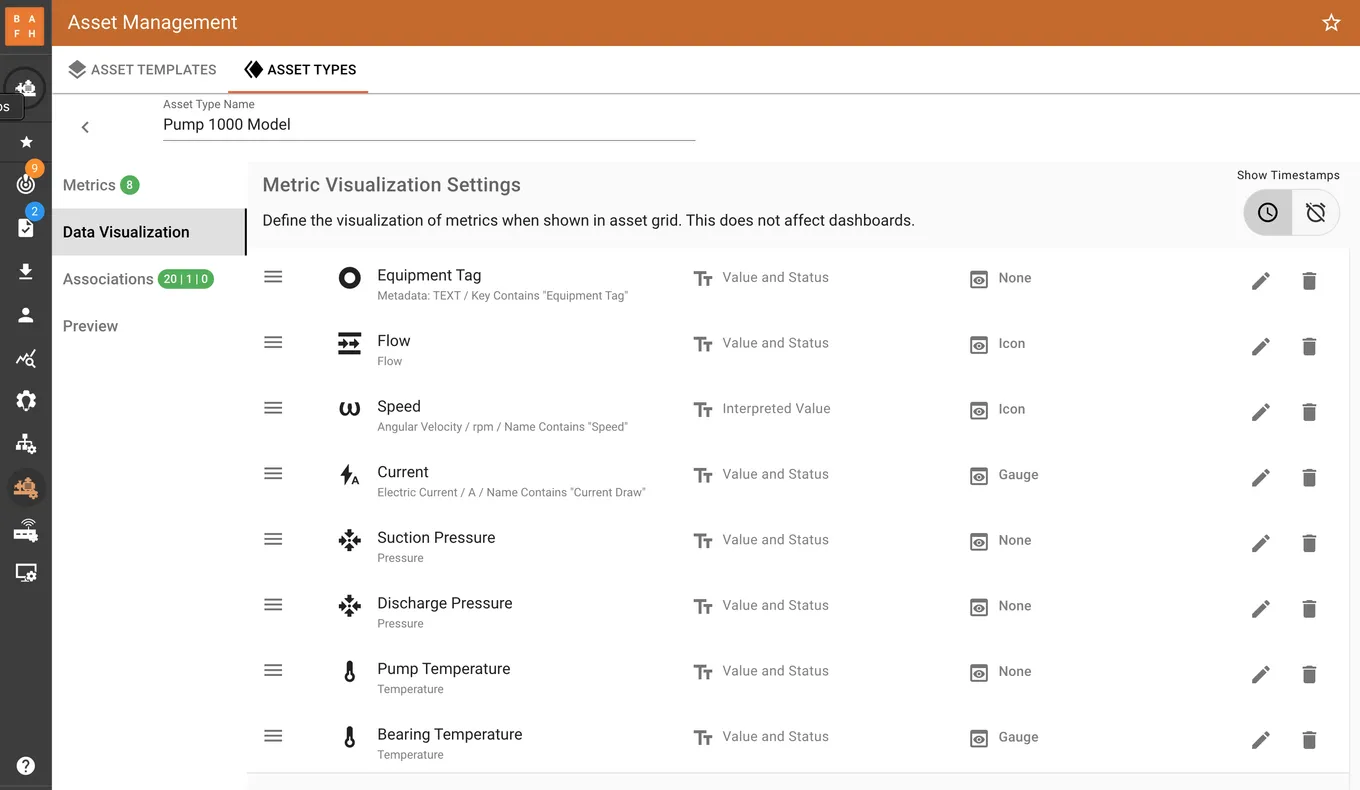
Define an asset type once and view, configure, and manage every matching piece of equipment as a fleet.
Data pipeline.
From raw signal to fired condition.
Every signal streams into ExoSense already normalized: transforms convert raw values into the units and derived calculations your condition logic actually runs against. From there, threshold checks, multi-signal correlations, and insight functions all evaluate continuously against that live stream, not on a polling interval or a nightly batch job.
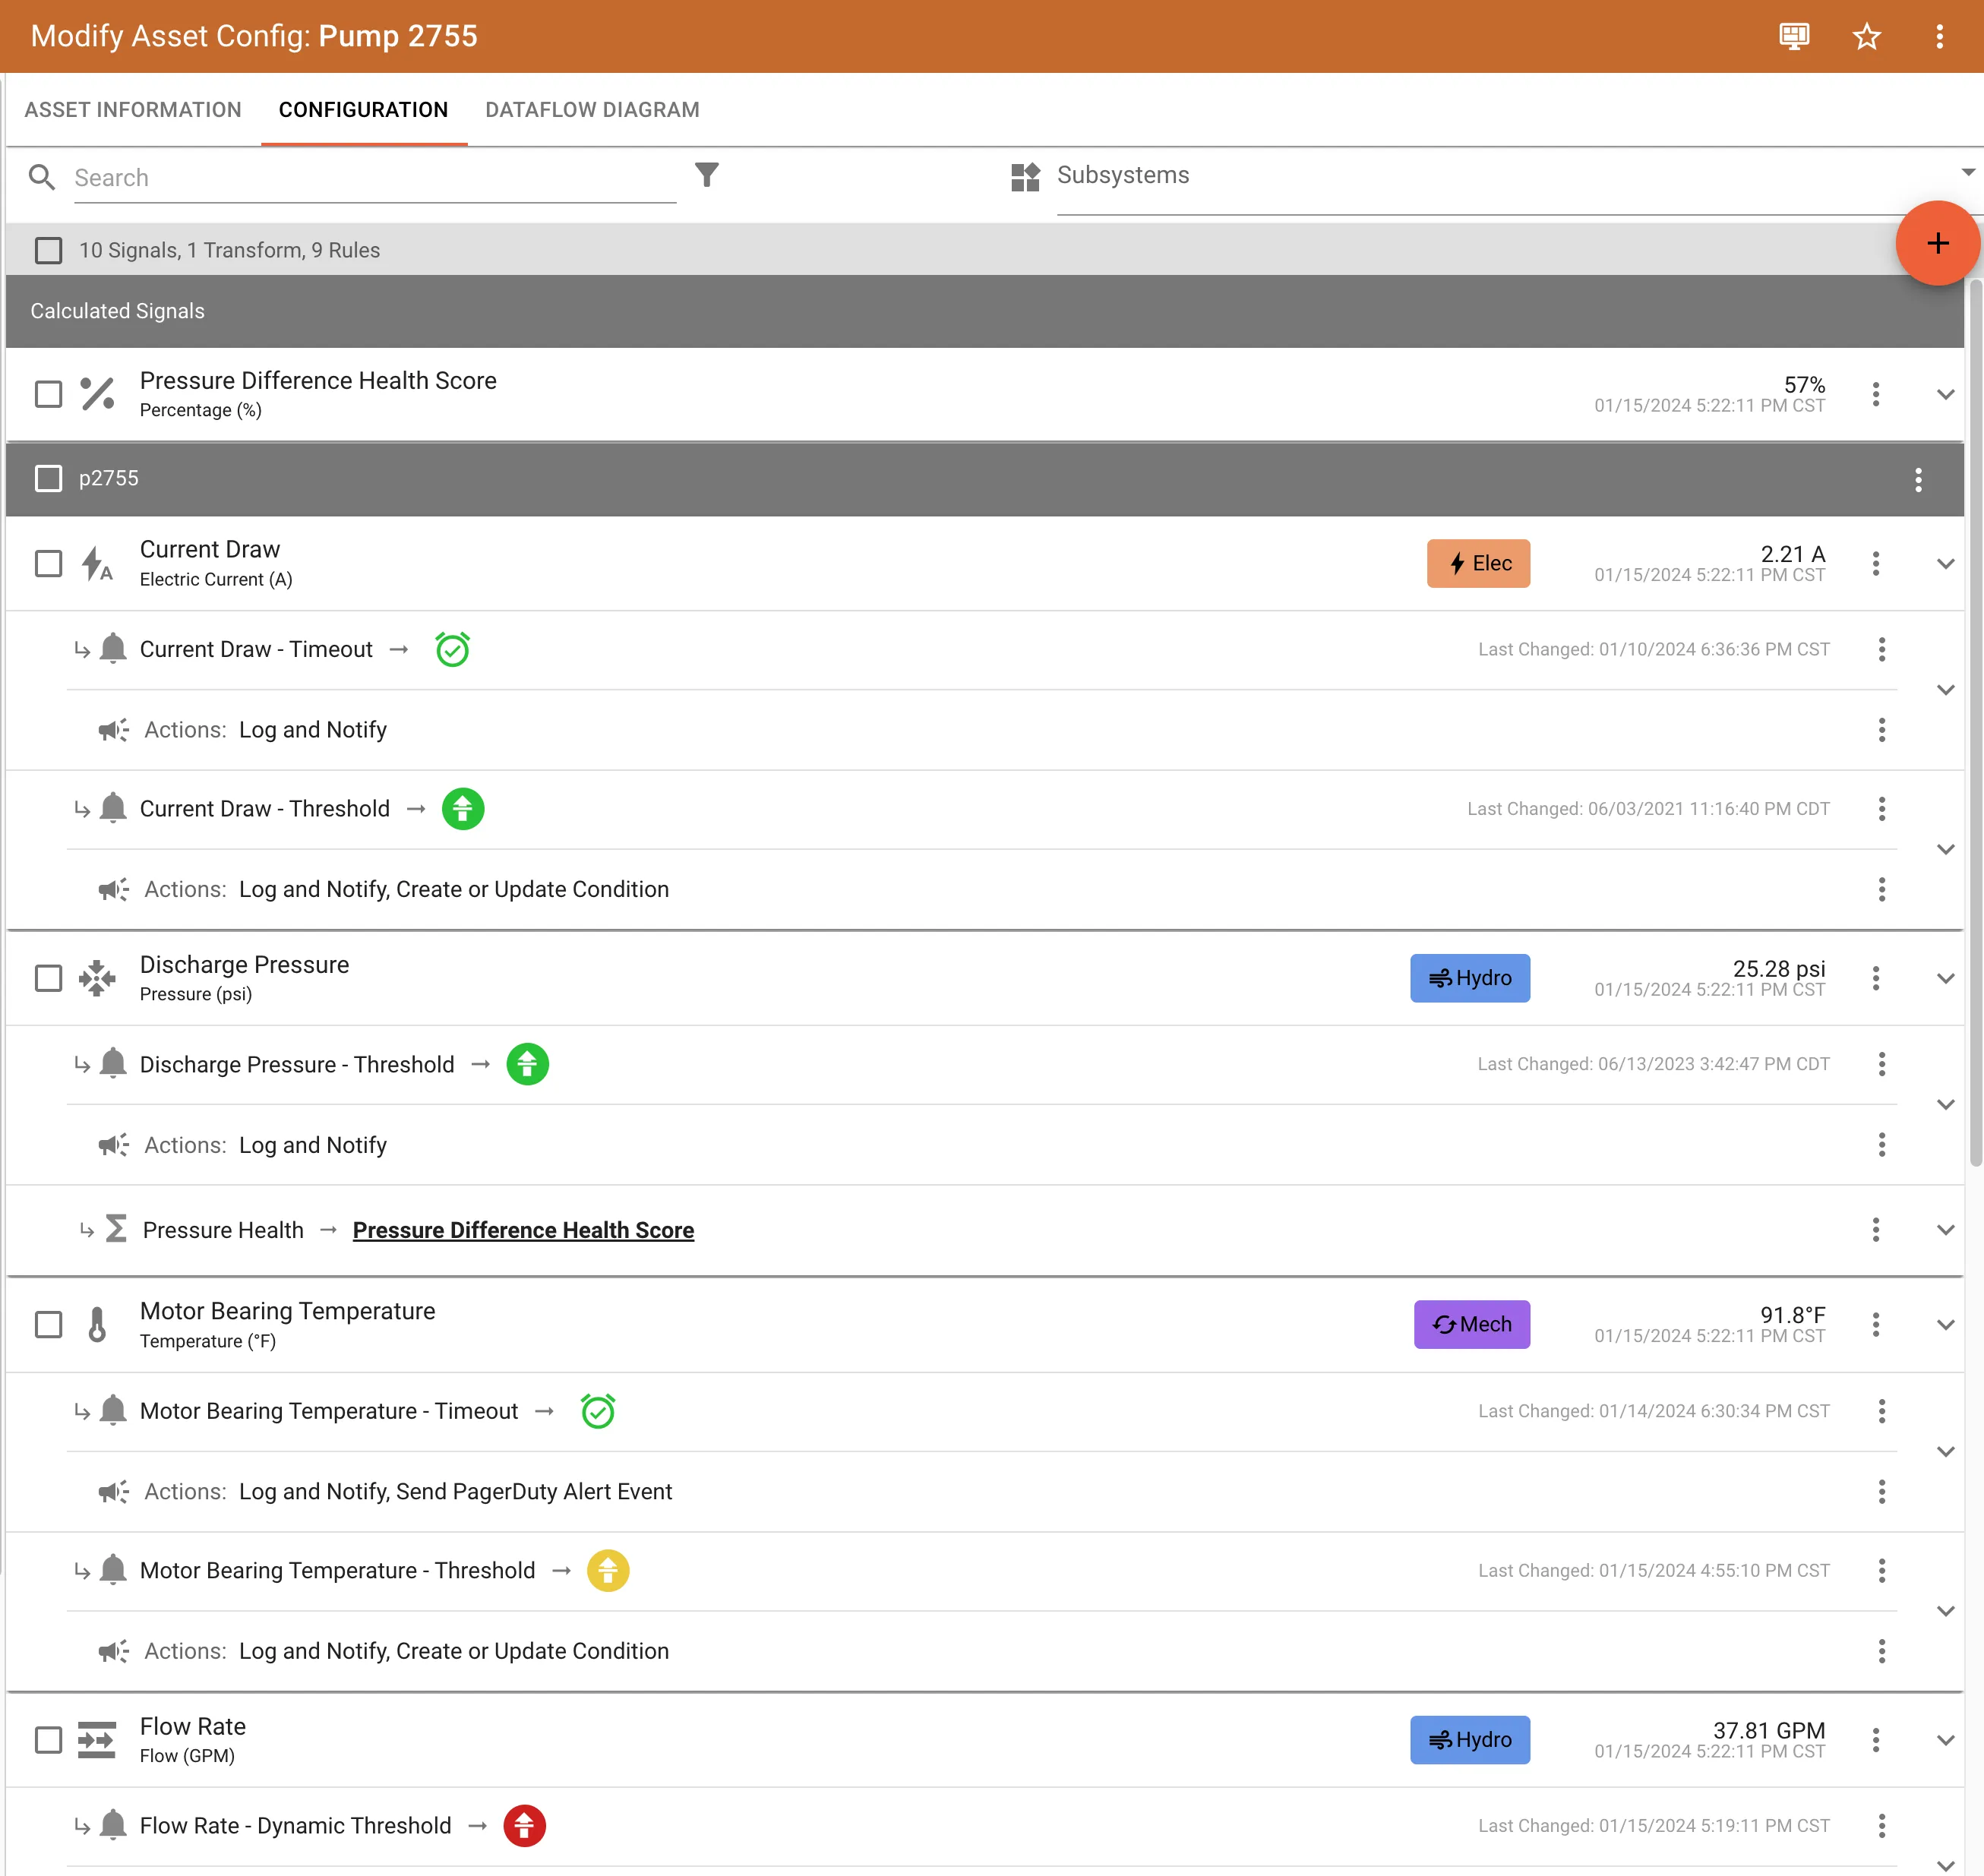
Signal transforms
Raw values get converted into the units, scaled ranges, and derived calculations condition logic runs against, before a single rule ever fires.
Threshold alerts
Set high/low limits on any signal: temperature, vibration, pressure, flow. Threshold rules natively support durations, counts, and hysteresis to reduce false positives.
Multi-condition logic
Combine signals into compound rules: alert only when vibration and temperature are both elevated, not either alone.
Condition history
Full log of every event: when it opened, when it closed, who acknowledged it, and what action was taken.
Driving action.
The collection of data from your equipment can let you see how it's operating, but it's critical to be able to take action from that data. Beyond rule-based notifications, organizations can use custom Action functions and Condition Policies to manage failure modes, detected conditions, and the health of their assets.
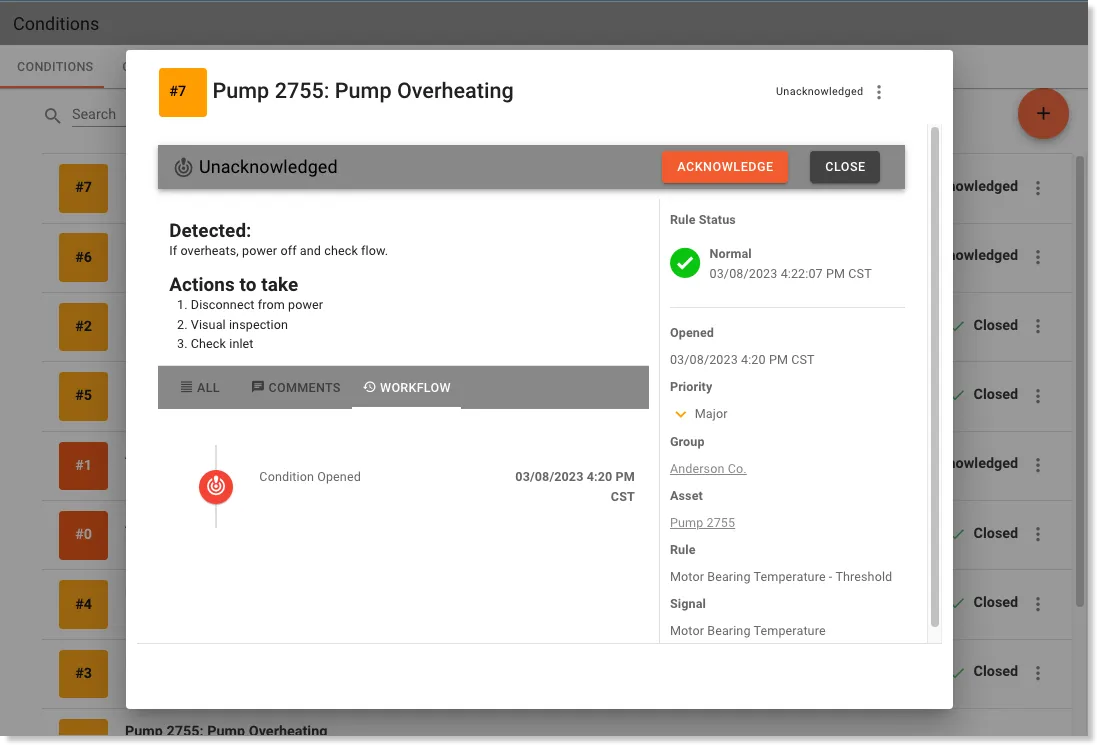
Condition workflow
Every condition moves through a clear status: detected, acknowledged, and closed, with a full history of who did what and when.
Guided response
Conditions can carry the actions a technician should take, what to check first, what to disconnect, what to inspect. No guessing what an alert means.
Connect to your systems
Route conditions into the CMMS or ticketing system your team already runs with Action integrations.
Built for OEM and service-provider scale.
ExoSense is multi-tenant by design: each customer organization sees only their own assets, dashboards, and team members. Configure an asset type once and deploy it across the fleet in minutes. And because ExoSense deploys under your name, your customers see your product, not ours.
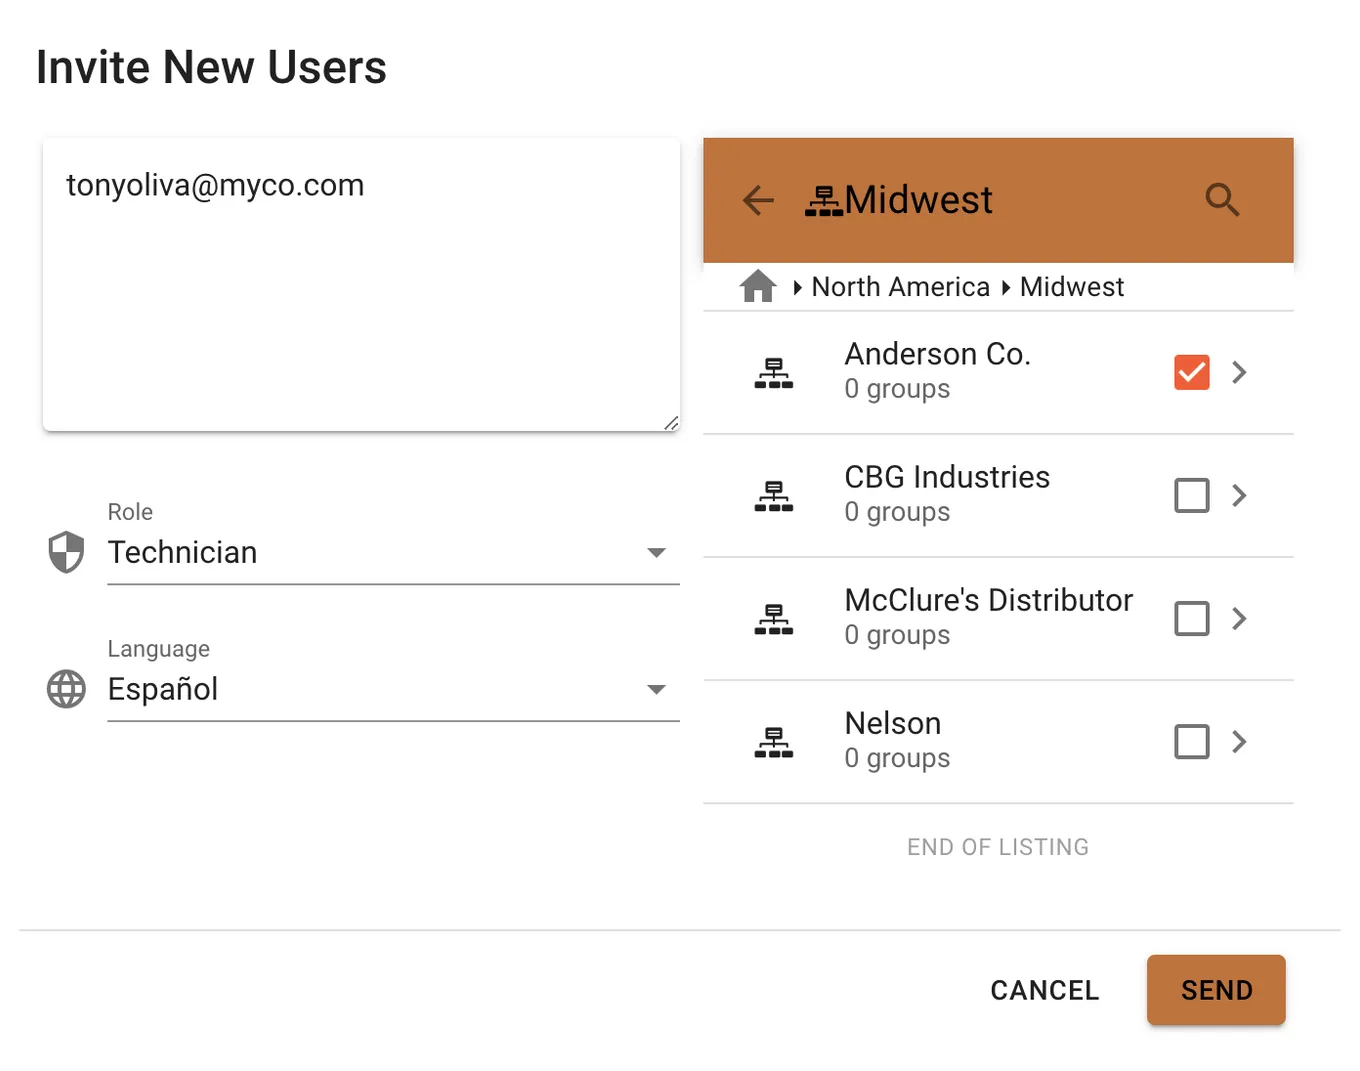
Multi-tenant access
Invite users with role-based permissions, operator, technician, manager, admin, scoped to the customer group and site they belong to.
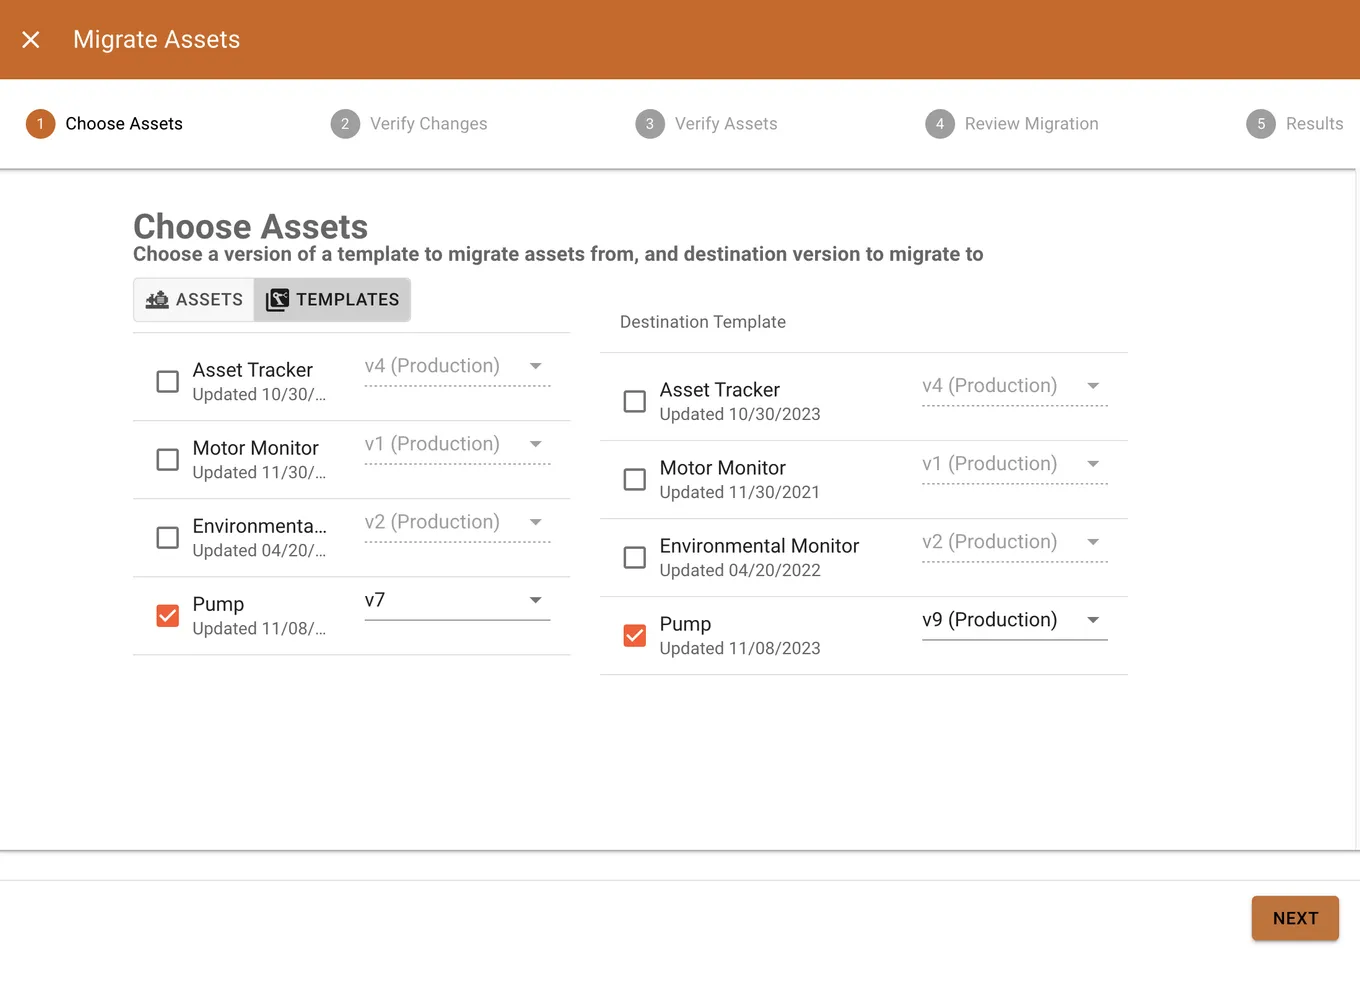
Template assets
Define an asset type once, its signals, rules, and dashboards, then migrate or roll it out across every matching asset in the fleet.
Repeatable configuration
Change how a metric displays at the asset-type level once, and every asset of that type picks it up. No per-asset rework.
Solutions built on ExoSense
Equipment makers and service providers use ExoSense for each of these.
- Condition MonitoringReal-time equipment health, alerts, and dashboards for your customers.
- Predictive MaintenanceAnomaly detection and machine learning in the data pipeline to catch failures early.
- Service TransformationMove from selling equipment to selling uptime and recurring service.
- OEM Connected ProductsConnect your product for usage data, field feedback, and over-the-air updates.
Your customers are already asking for live equipment visibility.
ExoSense is live in weeks, not quarters: configured for your equipment, connected to your customers, ready to go.